|


2010, Vol. 5 No. 1, Article 51
Immunopathology of Ochratoxicosis - A in
New Zealand White Rabbits (Oryctolagus cuniculus)
M. S. Mir*1 and P. Dwivedi
Division of Pathology,
Indian Veterinary Research Institute, Izatnagar-243122 (U.P)
*Corresponding Author;
e-mail address: [email protected]
ABSTRACT
Immunopathological effects of ochratoxin-A (OT-A) were evaluated in young (8 weeks old) rabbits following experimental exposures
to OT-A @ 0, 1 and 2 ppm of feed for 8 weeks. OT-A caused a significant depression in humoral and cell mediated immune responses, as
reflected by decreased antibody titers to sRBC, DH response to DNCB and PHA, and mitogenic response of lymphocytes to PHA-M and Con-A; depletion of lymphoid cells in primary and secondary lymphoid organs; higher establishment of the pathogen viz. Pasteurella multocida and greater susceptibility to the ensuing disease. However, feeding of OT-A up to 15 days did not alter NK cell activity.
KEY
WORDS
Immunopathology, immunosuppression, Ochratoxin-A, rabbit.
INTRODUCTION
Ochratoxin-A (OT-A), a toxic secondary metabolite of
Aspergillus and Penicillium species of fungi, has a wide toxicopathological spectrum encompassing nephrotoxicosis, hepatotoxicosis, immunomodulation, teratogenesis and carcinogenesis in various species of animals and poultry (1-8). Rabbits appear to be highly susceptible to ochratoxicosis (2-4, 9-12). In India, ochratoxin has been reported as a natural feed contaminant including
that of rabbit feed (13,14). Rabbit farming is a developing industry in India
hence, an investigation was undertaken to evaluate the effect of OT-A on immune system/ immunity in rabbits.
MATERIALS AND METHODS
Animals and Diets: OT-A was produced by culturing Aspergillus ochraceus NRRL-3174 on sterile maize (15). After establishing the OT-A levels in the cultured maize by thin layer chromatography, it was mixed with rabbit feed in proportions so as to give a final concentration of 1 or 2 ppm.
A total of 30, New Zealand white rabbits of 8 weeks age and weighing 350-400 gm, belonging to either sex were procured from Laboratory Animal Resource Division, IVRI, and allotted randomly to three groups (I, II and III). Group-I (n=6) was fed control diet tested to be free of AF-B1 and OT-A. Group II and III (n=12 each) were maintained on 1 and 2 ppm OT-A diets respectively.
Haemagglutination (HA) Titers against Sheep Erythrocytes (sRBC): HA titers were studied in rabbit serum following immunization with sRBC. 1 ml of the sRBC suspension, having 4x10⁸ RBC per ml, was injected intravenously to rabbits in each group for sensitization as well as for challenge. Four rabbits from each group were sensitized, two each on day 15 and day 25 and then challenged 10 days after sensitization. The HA titers were studied after 5 days of sensitization and 5, 10 and 15 days post challenge, by employing 1% sRBC suspension following the standard technique (16).
Contact Hypersensitivity to 2,4-Dinitrochlorobenzene (DNCB): Two rabbits from each group were tested for delayed hypersensitivity (DH) response employing 2,4- DNCB (Sigma Chemical Co., USA). Two sites were selected for the test application, viz. outer surface of pinna and flank region. The sites on either side of the body were cleaned of the hair using a soft hair removing lotion (pre-tested for any allergic reaction) followed by alcohol wash, about half an hour before application of test chemical. Areas of 2 cm diameter were marked. The dose of DNCB application was standardized by conducting pilot trials on rabbits. Acetone:olive oil (4:1) was used as vehicle. For sensitization 20µl of 2% solution of 2,4-DNCB in vehicle was used, while 20 µl of 0.5% solution was used for challenge. The solutions were applied percutaneously, slowly so as to cover whole area and at the same time avoiding its spread beyond the marked region. The contralateral site was used as control where only equal volume of vehicle was applied. The sensitization was carried out on day 25 and challenge dose applied 10 days post-sensitization. Thickness of skin/ear (pinna) and extent of reaction at the sites were measured at 0, 24, 48 and 72 hours post-challenge with the help of vernier calipers. Readings were taken in triplicates. The animals were examined regularly for macroscopic lesions, viz. erythema, induration and vesicle formation. Biopsies were taken from the skin test sites at 24, 48 and 72 hours of challenge for histopathological studies.
Delayed Hypersensitivity to Phytohaemagglutinin (PHA): PHA-P (Sigma Chemical Co., USA) was used, in vivo, to assess non-specific delayed hypersensitivity response on day 15 and 28. PHA-P, 100µg in 0.1 ml sterile phosphate buffer saline (PBS), was injected intradermally in flank region after clearing the area. The response was assessed by measuring the changes in skin thickness after 24, 48 and 72 hours. Also the site was examined regularly for macroscopic lesions viz. erythema, induration and vesication. Biopsies were taken from the test sites at 24, 48 and 72 hours, for evaluation of histopathological changes.
MTT Cytotoxicity Assay: Cytotoxicity assay was carried out to test the effect of OT-A on lytic potential of rabbit NK cells on vero-cell target, at day-30, after Espevik and Meyer (17).
Lymphocyte Proliferation Assay using MTT: Lymphocyte proliferation test using MTT, and Con-A and PHA-M (non-specific stimulants) was performed at day 45 (18).
Susceptibility to Infection: Six rabbits from each group (I, II & III), after three weeks on experimental diets, were infected with P. multocida 12:A intranasally @1 x 10⁶ CFU in 1 ml broth. Animals were examined weekly for recovery and assessment of bacterial load of P. multocida in nasal cavity and blood, and also trachea and lungs following death or sacrifice of the animals.
Pathoanatomy of Lymphoid Organs: Two animals from each group were sacrificed fortnightly from day 15 to day 60 and spleen, mesenteric lymph node and thymus were collected. All these organs were examined for gross and histopathological lesions. Also these organs were weighed and relative weights calculated as follows: Organ weight factor = (organ weight/whole carcass weight) x 100
RESULTS
HA Titers to sRBC: Results of HA titers to sRBC following sensitization of rabbits on day 15 and 25 are presented in Table 1. The sensitization titers of OT-A intoxicated animals (Group- II and III) did not differ significantly from those of control animals following sensitization on day 15. However, titers obtained at 5, 10 and 15 days post-challenge were significantly (P < 0.05) lower in OT-A intoxicated animals. At day 5 post-challenge the titers were significantly (P < 0.05) higher in 2 ppm group when compared with 1 ppm group. Despite day 10 and 15 post-challenge titers being more in 2 ppm group than in 1 ppm group, the differences were insignificant.
Following day 15 sensitization, the sensitization titers as well as challenge titers in intoxicated animals were significantly (P<0.05) lower than those in controls. The two
treatment groups (II & III) however, did not differ significantly in either sensitization or challenge titers from each other.
Contact Hypersensitivity to DNCB: Development of mild hyperaemia marked the start of reaction immediately following challenge exposures to DNCB, over the sensitized site in the flank region of control animals (Group-I). At the ear site in the control animals and at both sites in the OT-A intoxicated animals (Group-II & III), hyperaemic reaction started at 8-10 hours post DNCB testing. In control animals (Group-I) gross lesions at 24 hours post-challenge were characterized by extensive erythema, oedema, induration and vesicle formation. In a few of the control animals, reaction was very extensive involving ear from root to middle of the pinna and almost complete flank region. In OT-A intoxicated animals, reaction was less intense and the vesicle formation was not observed. The intensity of the lesions decreased progressively up to 72 hours post-challenge, when no macroscopic lesions could be noticed in the intoxicated animals except for slight discolouration of the skin. The application of vehicle alone as a control did not elicit any visible reaction.
Measurement of skin thickness and extent of reaction (diameter) (Table 2) revealed that peak response reached by 24 hours at both the test sites and in both the control and OT-A treatment group animals. Thereafter, the intensity of thickness tended to decline and the reaction almost subsided by 72 hours post-challenge. At either of the sites, the OT-A intoxicated animals showed a significantly (P<0.05) lowered response as compared with those observed in the controls. The mean increase in the skin thickness at 24 and 48 hours did not differ significantly in 1 and 2 ppm OT-A dose groups. Extent of reaction as assessed by measurements of the diameter around the test sites also revealed a significantly (P<0.05) decreased response in the treatment groups compared with those in controls.
Histopathology of the skin biopsies revealed that the nature and pattern of cellular and vascular responses at either of the skin test-sites (ear and flank) were similar. At 24 hours post-challenge the cellular reaction, in the control animals, was characterized by predominance of macrophages and epithelioid cells with an admixture of a few lymphocytes and polymorphs, in the upper layer of dermis. In both the OT-A intoxicated animal groups, heterophils were predominant cell type observed while lymphocytes and macrophages could be seen only occasionally (Fig. 1 and Fig. 2). In group- III (2 ppm OT-A) animals, mild eosinophilic reaction was also evident. Focal aggregation of epithelioid cells and fibroblasts were noticed occasionally, in all the groups. The infiltrating cells were seen mostly around the blood vessels which were congested. Dilatation of lymphatics, moderate degree of oedema and slight haemorrhage were also observed. In general, the cellular and vascular changes were comparatively milder in treatment groups than in the control group animals. At 48 hours post challenge the reaction in all the groups were less pronounced than at 24 hours post-challenge. The cellular reaction was marked by predominance of epithelioid cells and macrophages with presence of lymphocytes and a few heterophils especially in the deeper layers (Fig. 3). At 72 hours post-challenge the reaction in the control animals was similar to that at 48 hours but of milder intensity. In treatment groups, epithelioid cells with only occasional lymphocytes or polymorphs were observed.
DH Response to PHA: Swelling at the flank site of PHA injection was the only noticeable gross lesion. Measurements of the skin thickness and diameter of the reaction site (Table 3) revealed the peak response by 24 hours in both the control and intoxicated animals, followed by a progressive decline upto 72 hours. A significant (P< 0.05) depression in PHA-induced increase in skin thickness was observed in both the OT-A groups when tested either on day 15 or on day 28. At 24 and 48 hours post-testing, DH responses in 2 ppm group (Group III) were significantly (P< 0.05) depressed than in 1 ppm group (Group II). The DH response of the control and intoxicated animals on day 28 did not differ significantly from that observed on day 15.
Histologically the cellular and vascular changes observed at 24, 48 and 72 hours post PHA injection showed a pattern similar to that observed in DNCB test. However, unlike DNCB test, the cellular reaction in control animals at 24 hours post-testing on day 15 was characterized by heterophilic predominance while on day 28 lymphocytes were the main infiltrating cells at the reaction site. In 1 ppm OT-A group (Group- II) animals, reaction at 24 hours post-testing, either on day 15 or 28, was usually lymphocytic but heterophils were, also, observed especially in deeper layers. In 2 ppm OT-A group (Group III) animals, on day 15 heterophils were the predominant infiltrating cell types, along with some lymphocytes, a few plasma cells and macrophages (Fig 4). However, on day 28 macrophages, lymphocytes and heterophils were almost in equal numbers (Plate 5). Heterophils were more predominantly noticed along with a few eosinophils in the peripheral areas. At 48 hours post-testing, lymphocytes and macrophages were the predominant cell types infiltrating the reaction site along with a few heterophils, on either day 15 or 28, in both 1 ppm and 2 ppm OT-A groups, in general, degree of reaction was very mild in high OT-A dose group. At 72 hours only epithelioid cells were seen; lymphocytes and macrophages were virtually absent.
MTT Cytotoxicity Assay: The mean percent cytotoxicity observed in the 0, 1 and 2 ppm OT-A group animals are presented in Table 4. The cytotoxic activity of NK cells from animals fed on 1 ppm or 2 ppm OT-A for 15 days did not differ significantly from that of control.
Lymphocyte Proliferation Assay using MTT: The stimulation indices, following PHA-M and Con-A induction, of lymphocytes collected from rabbits kept on 0, 1 and 2 ppm OT-A diets for 45 days are presented in Table 4. In general, the response to PHA-M was higher than that of Con-A.
A significantly (P< 0.05) lowered mitogenic response of the lymphocytes from the animals of treatment groups, to both the non-specific mitogens was observed. The stimulation indices to both the mitogens in 1 and 2 ppm OT-A groups were found to differ significantly (P< 0.05) suggesting a dose-dependent effect of OT-A.
Susceptibility to Infection: Following infection with
P. multocida, acute pasteurellosis was observed in some intoxicated animals (Group-II and III). One animal from group-I and two from group-II died of pasteurellosis. The infected rabbits from all the three groups were examined for recovery and evaluation of bacterial load of
P. multocida in nasal cavity and blood and also in trachea and lungs following death or sacrifice. While
P. multocida could not be recovered from blood of the rabbits from any of the groups, the organism load as determined by colony forming units in nares (104 per cm sq), trachea (103 per cm sq) and lungs (per gm) respectively was 1-2.5, 1-1.5 and 800 in group-I; 3-4.7, 2-3.2 and 7x10³ – 12x103 in group-II; and 2.5-5.2, 3-3.5 and 8x10³ – 15x103 in group-III, infected rabbits. Highest counts were observed in infected animals from group-III which died of pasteurellosis.
Gross and Histopathology of Lymphoid Organs: Grossly thymus from both the intoxicated group animals (Group-II and III) revealed varying degrees of enlargement and haemorrhages after day 30. Incidentally mesenteric lymphnodes were oedematous and haemorrhagic. The effects of OT-A intoxication on organ weights have been presented in Table 5. The results revealed comparatively higher absolute as well as relative (expressed as percent body weight) organ weights of spleen, mesenteric lymphnodes and thymus. Histopathologically lymphoid organs revealed degeneration and necrosis of lymphoid cells in lymphnodes, spleen, thymus as well as submucosal lymphoid tissue in caecum. At times even complete washing out of follicles was observed.
DISCUSSION
Effects of 1 and 2 ppm OT-A on the immune system of young rabbits was evaluated using multipronged approach with several parameters such as effects on primary and secondary lymphoid organs, humoral and cell mediated immune responses, lymphocyte response to mitogens, NK-cell effector function as well as the distribution and load of infectious agent over time and resistance to development of disease. These studies revealed that OT-A was highly immunotoxic to rabbits causing suppression of both humoral and cell mediated immunity.
Histopathological examination of various lymphoid organs/tissues, including thymus, spleen, mesenteric lymph nodes and submucosal lymphoid tissues in the caecum revealed degeneration and necrosis of lymphoid cells resulting not only in their depletion and decreased cellularity but at times even complete washing out of follicles in OT-A intoxicated animals. The observations in these organs may be correlated with the relative and absolute lymphocytopaenia caused by OT-A intoxication (11).
Antibody response to sRBCs was found to be considerably decreased in rabbits sensitized at either 15 or 25 days of OT-A feeding and challenged 10 days post-sensitization. Decreased antibody response has been reported during ochratoxicosis in mice, guinea pigs and chicken (19-24) lending support to our findings. In the context of the histopathological and haematological observations the reduced humoral immune response seems to be a result of direct effect of OT-A on the B-lymphocytes and plasma cells (11,12,19,22,23,25) causing cell degeneration and necrosis as well as inhibiting the lymphocyte proliferation and plasma cell formation. OT-A has been reported to induce dose-dependent apoptosis of human peripheral blood lymphocytes through a mitochondrial pathway leading to caspase activation, besides provoking a decrease of Bcl-xL expression that may be a trigger for OT-A-induced apoptosis (26). The depletion of lymphocytes in lymphoid organs in ochratoxicosis has also been reported in other species of animals (20,27-31). Suppression of humoral immune responses based on histopathological changes in bursa and other lymphoid tissues/organs, ultrastructural changes in lymphoid and plasma cells, decreased serum and tissue IgA, IgG and IgM levels in different organs have been reported in broilers and turkeys in ochratoxicosis (19,32-34). Further in view of sRBCs being thymus dependent antigen, role of suppressed helper T-lymphocyte activity in reduced humoral responses has also been suggested (35). Functionally intact thymus is necessary for the switch over mechanism of IgM and /or IgA to operate successfully (36). Reduced IgM and IgG levels have been observed in OT-A treated mice (37) and quail (38) which correlates well with the observation of decreased sensitization and challenge antibody titers in present study after 25 days.
CMI responses, as assessed by cutaneous DH reaction to DMCB and PHA were found significantly reduced due to OT-A in a dose dependent manner, in rabbits. The DNCB skin test has been considered to be one of the reliable tests for assessing CMI responses (39). Intradermal PHA- test has been employed to evaluate T-cell mediated responses in chicken (40), human being (41) and swine (42-44). OT-A induced decreased CMI response has been documented in poultry (20,21,33,34,45-46) and gilts (44).
Lymphocyte proliferation test using T-cell mitogens (PHA-M and Con-A) revealed a significant reduction in the stimulation indices of the lymphocytes from OT-A treated animals. These observations are in agreement with the reports in quail (46), mice (37,47), swine (44,48) and human being (49).
The reduced CMI responses may be attributed to OT-A induced degeneration of T-lymphocytes as well as to reduced T-cell responsiveness as evidenced by the histopathological changes in lymphoid tissues, lymphocytopaenia and reduced stimulation indices in the lymphocyte stimulation test. The extensive degeneration and necrosis of lymphocytes observed in thymus, the maturation site for T-cells and also in spleen wherein 55% lymphocytes are T-cells (50) provides strong evidence for the lymphotoxic effects of OT-A on T-cells. Majority of circulating lymphocytes being T-cells, the observed lymphocytopaenia further strengthens the view. T-cells have been demonstrated to take up OT-A and secrete it at a comparatively lower rate in fresh media (51). Further, no hydroxylated metabolites were released by the T-lymphocytes. OT-A treated lymphocytes were reported to be negative for the presence of IL-2 receptors and IL-2 production was also reduced. Thus OT-A seems to have direct action on T-cells and presence of toxin in the cell environment appears to play an important role. This view is also supported by our observation of improved responses of T-cells to mitogens at 3 weeks post-toxin withdrawal, especially in low dose group animals (4).
Inhibition of NK cell activity due to OT-A induced impaired IFN induction has been reported in mice (52). Evaluation of NK cell activity in the present studies using MTT cytotoxicity assay and vero-cell targets, revealed that feeding of OT-A @ 1ppm and 2ppm to rabbits for 15 days did not affect the NK cell activity. The short term exposure of rabbits to OT-A may account for the observed difference in the NK cell activity in the present studies.
Besides measuring skin thickness and diameter of the DH reaction to DNCB and PHA, cutaneous cellular reactions to the test antigens were also evaluated. The cellular responses and vascular changes were found to be consistently reduced in the OT-A treated animals compared with those of control animals. Cellular reaction in control animals were characterized by predominance of mononuclear cells whereas polymorphonuclear leucocytes were predominantly observed in the OT-A treated animals. These findings were supported by the similar observations on DH responses and gross lesions as well as cellular reactions in chicken and turkey by Dwivedi11. an epidermal cell-derived thymocyte-activating factor (ETAF), a cytokine indistinguishable from macrophage derived lymphokine (IL-1), has been isolated from murine and human keratinocytes, the principal cell in the epidermis (53,54). ETAF production can be induced by mitogenic agents and cell damage or by injurious agents and has been found to be responsible for IL-2 production by T-lymphocytes and to be chemotactic for neutrophils. If a similar mechanism operates in rabbits the inflammatory and immunological reactions observed in the present study can be more readily explained.
Bacterial counts in the respiratory tract of the rabbits following infection with low doses of
P. multocida 12:A, intranasally were found to be comparatively higher in the OT-A intoxicated animals, supporting thereby higher establishment of the pathogen during ochratoxicosis. Higher susceptibility of intoxicated animals in the disease was evidenced by development of acute pasteurellosis and higher mortality in animals from high dose group as well as severity of lesions. These observations might be explained on the basis of immunomodulation and immunosuppression as observed in OT-A intoxicated and the infected groups.
REFERENCES
-
Marquardt RR, Frohlich AA. A review of recent advances in understanding ochratoxicosis. J. Anim. Sci., 1992; 70: 3968-3988.
-
Mir MS, Dwivedi P, Charan K . Ochratoxin – A induced acute toxicity in rabbits. Indian J. Vet. Pathol., 1999; 23: 8-13.
-
Mir MS, Dwivedi P. Ochratoxin-A Induced Nephrotoxicity in Rabbits. Second J & K Science Congress, 25-27 July 2006, University of Kashmir, Srinagar, Kashmir (J&K). 2006a; Ab VET-7: 26-27.
-
Mir MS, Dwivedi P. Residue dynamics and built-up of ochratoxin-A following sub-acute intoxication in rabbits. Second J & K Science Congress, 25-27 July 2006, University of Kashmir, Srinagar, Kashmir (J&K). 2006b; Ab.VET-8: 27.
-
Bennett JW, Klich M. Mycotoxins. Clin. Microbiol Rev., 2003; 16(3): 497–516
-
Bozzo G, Ceci E, Bonerba IE, Desantis S, Tantillo G. Ochratoxin A in Laying Hens: High-Performance Liquid Chromatography Detection and Cytological and Histological Analysis of Target Tissues. J. Appl. Poult. Res., 2008; 17:151–156
-
Sava V, Velasquez A, Song S, Sanchez-Ramos J. Adult Hippocampal Neural Stem/Progenitor Cells In Vitro Are Vulnerable to the Mycotoxin Ochratoxin-A. Toxicol. Sci., 2007; 98(1): 187–197
-
Elaroussi MA, Mohamed FR, Elgendy MS, El Barkouky EM, Abdou AM, Hatab MH. Ochratoxicosis in broiler chickens: functional and histological changes in target organs. Int. J. Poult. Sci., 2008; 7 (5): 414-422
-
Viscont A, Bottalico A. Higher levels of ochratoxin-A and B in mouldy bread responsible for mycotoxicosis in farm animals. J. Agri. Fd. Chem., 1983; 31: 1122-1123.
-
Mir MS, Dwivedi P. Clinical studies on experimental subacute ochratoxicosis in rabbits. Indian J. Vet. Pathol., 2000; 24: 99-101.
-
Mir MS, Dwivedi P. Haematological alterations in New Zealand White rabbits (Oryctolagus cuniculus) due to subacute ochratoxicosis-A. SKUAST J. Res., 2008a; 10(2): 242-250
-
Mir MS, Dwivedi P. Pathology of induced ochratoxicosis-A in rabbits (Oryctolagus cuniculus). SKUAST J. Res., 2008b; 10 (1): 99-111.
-
Ranjan KS, Sinha AK. Occurrence of mycotoxigenic fungi and mycotoxins in animal feed from Bihar. Indian J. Sci. Fd. Agri., 1991; 56(1): 39-47.
-
Sharma P. HP rabbit farmers fear toxin in feed; mortality, infertility cases on rise. The Hindustan Times, 1998; LXXIV(210): 3.
-
Trenk FL, Butz ME, Chu FS. Production of ochratoxins in different cereal products by Aspergillus ochraceus. Appl. Microbiol., 1971; 21: 1032-1035.
-
Kobat EA, Mayer MM. Experimental immunochemistry. 2nd Ed. Charles Co. Thomas Publisher, Springfield, Illionis, USA. 1961
-
Espevik T, Meyer JN. A highly sensitive cell line, WEHI 164 clone 13, for measuring cytotoxic factor/ tumor necrosis factor from human monocytes. J. Immunol. Meth., 1986; 95(1): 99-105.
-
Bounous DI, Campagnoli RP, Brown J. Comparison of MTT colorimetric assay and tritiated thymidine uptake for lymphocyte proliferation assays using chicken splenocytes. Avian Dis., 1992; 36(4): 1022-1027.
-
Dwivedi P. The immunological and pathological changes in poultry induced by ochratoxin-A. Ph.D. Thesis, Univ. of Edinburgh, Scotland, 1984.
-
Singh GSP, Chauhan HVS, Jha GJ, Singh KK. Immunosuppression due to chronic ochratoxicosis in broiler chicks. J. Compar. Pathol., 1990; 103(4): 399-410.
-
Ramadevi V, Naidu NRG, Rao MVS. Effect of ochratoxin-A on immune system in broiler chicken. Indian Vet. J., 1996; 73(7): 722-724.
-
Stoev SD, Anguelov G, Ivanov I, Pavlov D. Influence of ochratoxin A and an extract of artichoke on the vaccinal immunity and health in broiler chicks. Exp. Toxicol. Pathol., 2000; 52: 43-55.
-
Santin E, Paulillo AC, Maiorka PC, Alessi AC, Krabbe EL, Maiorka A. The effects of ochratoxin/aluminosilicate interaction on the tissues and humoral immune response of broilers. Avian Pathol., 2002; .31: 73-79.
-
Elaroussi MA, Mohamed FR, El Barkouky EM, Atta AM, Abdou AM, Hatab MH. Experimental ochratoxicosis in broiler chickens. Avian Pathol., 2006; 35: 263-269.
-
Kumar A, Jindal N, Shukla CL, Asrani RK, Ledoux DR, Rottinghaus GE. Pathological changes in broiler chickens fed ochratoxin A and inoculated with Escherichia coli. Avian Pathol., 2004; 33:413-417.
-
Assaf H, Azouri H, Pallardy M. Ochratoxin A Induces Apoptosis in Human Lymphocytes through Down Regulation of Bcl-xL. Toxicol. Sci., 2004; 79: 335–344
-
Szczech GM, Carlton WW, Tuite J, Coldwell R.. Ochratoxin_A toxicosis in swine. Vet. Pathol., 1973b; 10: 347-364.
-
Szczech GM, Carlton WW, Tuite J. ochratoxicosis-A in Beagle dogs. II. Pathology. Vet. Pathol., 1973a; 10: 219-231.
-
Bitay Z, Glavits R, Sellyey G. Feeding experiments on broiler chickens with ochratoxin-A, patulin, t-2 and butenolide. Magyar Allatorvosok Lapja, 1979; 34: 417-422.
-
Aleksandrov M, Dzhurov A. Effect of ochratoxin – A on the health of broilers. Veterinarnomeditsinski Nauki, 1987; 24: 38-43.
-
Harvey RB, Kubena LF, Naqui SA, Gyimah JE, Corier DE, Panigrahy B, Phillips TD. Immunological effects of low levels of ochratoxin-A in ovo: utilization of a chicken embryo model. Avian Dis., 1987; 31: 787-791.
-
Dwivedi P, Burns RB. Effect of ochratoxin A on immunoglobins in broiler chicks. Res. Vet. Sci., 1984a; 36: 117-121.
-
Dwivedi P, Burns RB. Ochratoxicosis A in broilers and turkeys: a comparative immunological study. Proc. Abst. XVII Wld’s Poult. Cong. Exhib., Helsinki, Finland (Aug. 1984). 1984b; Sec. 4B10: 559-561.
-
Dwivedi P, Burns RB. Immunosuppressive effects of ochratoxin A in young turkeys. Avian Pathol., 1985; 14: 213-225.
-
Creppy EE, Stormer FC, Roschenthaler R, Dirheimer G. Effects of two metabolites of ochratoxin-A, (4R)-4-hydroxyochratoxin A and ochratoxin ά on immune response in mice. Infect. Immun., 1983; 39: 1015-1018.
-
Bienenstock J, Gaulde J, Perey DYE. Synthesis of IgG, IgA, IgM by chicken tissues: immunofluorescent and 14C amino acid incorporation studies. J. Immunol., 1973; 111: 1112-1118
-
Prior MG, Sisodia CS. The effects of ochratoxin-A on the immune response of Swiss mice. Canad. J. Compar. Med., 1982; 46: 91-96.
-
Farshid AA, Rajan A. Assessment of the humoral immune response of Japanese quail in experimental ochratoxicosis. Indian Vet. J., 1995; 72(2): 122-125.
-
Kuby J. Immunology. 2nd Ed. W.H. Freeman and Company, New York. 1993
-
Corrier DE, Deloach JR. Interdigital skin test for evaluation of delayed hypersensitivity and cutaneous basophil hypersensitivity in young chicken. Am. J. Vet. Res., 1990; 51: 950-954.
-
Pierard GE, Pierard-Franchimont C, Le T, Lorand T, Lapiere CM. A comparative study between interdermal test with phytohaemagglutinin and delayed hypersensitivity reactions elicited by tuberculin. Arch. Dermatol. Res., 1982; 274: 313-320.
-
Mann D, Hargis JW. Intradermal testing of swine to monitor changes in delayed hypersensitivity response. Am. J. Vet. Res., 1985; 46: 2363-2365.
-
Mallard BA, Wilkie BN, Kennedy BW. Genetic and other effects on antibody and cell mediated immune response in swine leukocyte antigen (SLA)- defined pigs. Anim. Genetics., 1989; 20: 167-178.
-
Harvey RB, Elissalde MH, Kubena LF, Weaner EA, Corrier DE, Clement BA. Immunotoxicity of ochratoxin-A to growing gilts. Am. J. Vet. Res., 1992; 53: 1466-1470.
-
Burns RB, Dwivedi P. Ochratoxicosis A in quail with particular reference to teratogenic effects. Vth Meet. Mycotox. Anim. Hum. Health., Edinburgh, Scotland, 1984
-
Farshid AA, Rajan A. Assessment of the cell-mediated immune response of Japanese quail in experimental ochratoxicosis. Indian Vet. J., 1996; 73: 1117-1121.
-
Thuvander A, Breitholtz-Emanuelsson A, Olsen M. Effects of ochratoxin-A on the mouse immune system after subchronic exposure. Fd. Chem. Toxicol., 1995; 33(12): 1005-1011.
-
Holmberg T, Thuvander A, Hult K. Ochratoxin-A as a suppressor of mitogen-induced blastogenesis of porcine blood lymphocytes. Acta. Vet. Scand., 1988; 29(2): 219-223.
-
Reubel GH, Gareis M, Amselgruber WM. Cytotoxicity evaluation of mycotoxins by an MTT bioassay. Mycot. Res., 1987; 3(2): 85-96.
-
Hoffman-Fezer G, Rodt H, Gotze D, Thierfelder S. Anatomical distribution of T- and B- lymphocytes identified by immunochemistry in chicken spleen. Int. Arch. Aller. Appl. Immunol., 1977; 55: 86-95.
-
Lea T, Steien K, Stormer FC. Mechanisms of ochratoxin-A induced immunosuppression. Mycopathologica, 1989; 107: 153.
-
Luster MI, Germolec DR, Burleson GR, Jameson CW, Ackermaun MF, Lamm KR, Hayes HT. Selective immunosuppression in mice of natural killer cell activity by ochratoxin-A. Cancer Res., 1987; 47: 2259.
-
Luger TA, Charon JA, Colot M, Mickshe M, Oppenheim JJ. chemotactic properties of partially purified human epidermal cell-derived thymocyte-activating factor (ETAF) for polymorphonuclear and mononuclear cells. J. Immunol., 1983a; 131: 816-820.
-
Luger TA, Sztein MB, Schmidt JA, Murphy P, Grabner G, Oppenheim JJ. properties of murine and human epidermal cell-derived thymocyte-activating factor. Federation Proc., 1983b; 10: 2772-2776.
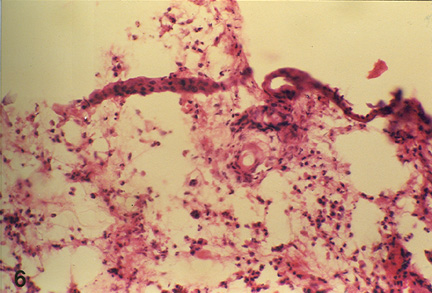 
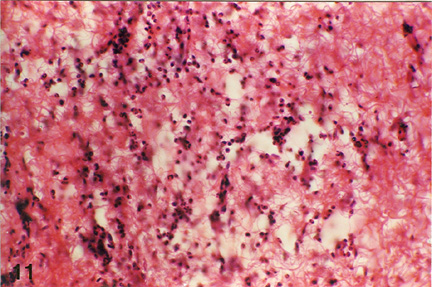
| Fig. 1: Microphotograph of flank skin of rabbit, DNCB test site, 1ppm OT-A, 24 hours post testing, showing heterophilic reaction with few mononuclear cells. H.E. x 295. |
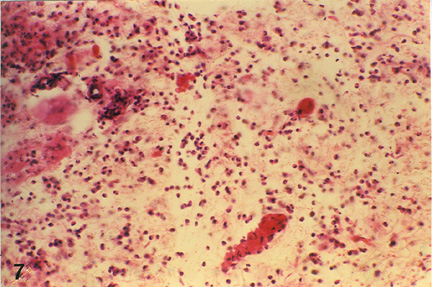
Fig. 2: Microphotograph of flank skin of rabbit, DNCB test site, 2ppm OT-A, 24 hours post testing, revealing heterophilic reaction with few eosinophils, macrophages and lymphocytes. H.E. x 295.
|
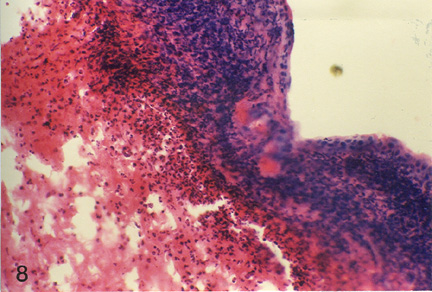 
| Fig. 3: Microphotograph of flank skin of rabbit, DNCB test site, 1ppm OT-A diet, 48 hours post testing. Note the predominance of epitheleioid cells and macrophages with few lymphocytes and heterophils in deeper layer. H.E. x 295 |
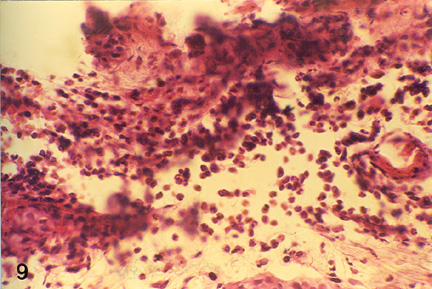
Fig. 4: Microphotograph of flank skin of rabbit, PHA test site, 2ppm OT-A diet for 15 days, 24 hours post testing, showing heterophilic reaction with few lymphocytes, plasma cells and macrophages. H.E. x 472.5.
|
| |
Fig. 5: Microphotograph of flank skin of rabbit, PHA test site, 2ppm OT-A diet for 28 days, 24 hours post testing, revealing lymphocytic and heterophilic reaction. H.E. x 295 |
|
|
Table 1: Haemagglutination (HA) titres to sheep erythrocytes in OT-A intoxicated rabbits (Mean + SE)
|
Days of Sensitization
|
Group
|
Sensitization titres (day 5)
|
*Challenge titres
(days post challenge)
|
|
|
|
|
Day 5
|
Day 10
|
Day 15
|
|
Day 15
|
I
|
5.85 + 0.250
|
41.75 + 1.450a
|
33.90 + 1.600a
|
21.70 + 1.600a
|
|
|
II
|
5.85 + 0.950
|
31.65 + 1.550b
|
21.70 + 1.400b
|
14.15 + 0.150b
|
|
|
III
|
5.35 + 0.550
|
34.70 + 0.400b
|
22.15 + 0.550b
|
15.20 + 0.500b
|
|
Day 25
|
I
|
5.70 + 0.400a
|
44.95 + 0.05a
|
38.20 + 1.000a
|
22.70 + 2.600a
|
|
|
II
|
3.70 + 0.450b
|
20.15 + 0.850b
|
13.90 + 1.400b
|
9.30 + 0.200b
|
|
|
III
|
3.85 + 0.250b
|
22.55 + 2.450b
|
14.85 + 1.350b
|
9.60 + 0.400b
|
|
Means of different groups bearing at least one common
superscript do not differ significantly (P< 0.05).
*
Rabbits were challenged on 10 days post
sensitization.
|
Table 2: Contact hypersensitivity to dinitrochlorobenzene (DNCB) in OT-A intoxicated rabbits, sensitized on day 25 (Mean + SE)
|
Parameters
|
Group No.
|
Ear Site
|
Flank Region
|
|
0 hour
|
24 hours
|
48 hours
|
72 hours
|
0 hour
|
24 hours
|
48 hours
|
72 hours
|
|
Skin Thickness
(cm)
|
I
|
0.100 + 0.010
|
0.163 + 0.010
|
0.119 + 0.006
|
0.110 + 0.008
|
0.153 + 0.022
|
0.226 + 0.014
|
0.178 + 0.020
|
0.169 + 0.022
|
|
II
|
0.071 + 0.010
|
0.105 + 0.010
|
0.180 + 0.010
|
0.077 + 0.009
|
0.104 + 0.009
|
0.138 + 0.010
|
0.111 + 0.011
|
0.107 + 0.009
|
|
III
|
0.104 + 0.010
|
0.134 + 0.008
|
0.113 + 0.012
|
0.109 + 0.009
|
0.131 + 0.010
|
0.168 + 0.003
|
0.143 + 0.015
|
0.136 + 0.013
|
|
Extent of skin
reaction (Diameter in cm)
|
I
|
2.001 + 0.001
|
2.940 + 0.009
|
2.603 + 0.016
|
2.437 + 0.044
|
2.000 + 0.001
|
2.968 + 0.096
|
2.589 + 0.038
|
2.365 + 0.050
|
|
II
|
2.000 + 0.001
|
2.497 + 0.034
|
2.254 + 0.060
|
2.022 + 0.009
|
2.000 + 0.001
|
2.463 + 0.048
|
2.273 + 0.037
|
2.062 + 0.130
|
|
III
|
2.000 + 0.001
|
2.500 + 0.002
|
2.303 + 0.008
|
2.037 + 0.001
|
2.000 + 0.001
|
2.569 + 0.066
|
2.210 + 0.117
|
1.987 + 0.114
|
Table 3: Contact hypersensitivity to phytohaemagglutinin (PHA) in OT-A intoxicated rabbits (Mean + SE)
|
Days Post Intoxication
|
Group No.
|
Skin Thickness (cm)
|
Extent of skin reaction (Diameter in cm)
|
|
0 hour
|
24 hours
|
48 hours
|
72 hours
|
24 hours
|
48 hours
|
72 hours
|
|
Day 15
|
I
|
0.064 + 0.008
|
0.213 + 0.012
|
0.139 + 0.003
|
0.100 + 0.001
|
1.655 + 0.025
|
1.385 + 0.035
|
0.840 + 0.190
|
|
II
|
0.066 + 0.001
|
0.187 + 0.002
|
0.119 + 0.005
|
0.089 + 0.002
|
1.135 + 0.045
|
0.930 + 0.020
|
0.545 + 0.005
|
|
III
|
0.063 + 0.008
|
0.168 + 0.019
|
0.106 + 0.019
|
0.190 + 0.010
|
1.085 + 0.005
|
0.825 + 0.045
|
0.555 + 0.035
|
|
Day 28
|
I
|
0.046 + 0.004
|
0.208 + 0.005
|
0.119 + 0.004
|
0.104 + 0.012
|
1.550 + 0.020
|
1.260 + 0.060
|
0.595 + 0.035
|
|
II
|
0.070 + 0.001
|
0.188 + 0.001
|
0.120 + 0.002
|
0.088 + 0.003
|
0.995 + 0.235
|
0.835 + 0.095
|
0.670 + 0.050
|
|
III
|
0.071 + 0.020
|
0.150 + 0.022
|
0.107 + 0.008
|
0.081 + 0.009
|
0.880 + 0.240
|
0.720 + 0.100
|
0.580 + 0.080
|
Table 4: Cytotoxicity of NK cells (at day 30) and lymphocyte response to PHA-M and Con-A (at day 45) in OT-A intoxicated rabbits.
|
Group
|
% Cytotoxicity (at day 30)
|
Stimulation Indices (at day 45)
|
|
PHA-M
|
Con-A
|
|
I
|
76.2418 + 0.3396
|
0.4230 + 0.0160a
|
0.2250 + 0.0140a
|
|
II
|
76.4706 + 0.2602
|
0.2674 + 0.0032b
|
0.1659 + 0.0086b
|
|
III
|
76.2325 + 0.3234
|
0.2050 + 0.0188c
|
0.1148 + 0.0109c
|
|
Means bearing different superscripts differ significantly.
|
Table 5: Effect of sub-acute intoxication on the absolute and relative organ weight at different time intervals up to 60 days (Mean + SE)
|
Days Post Intoxication
|
Group No.
|
Body Weight
(gm)
|
Organ Weight (gm)
|
|
Spleen
|
Mesenteric Lymph Node
|
Thymus
|
|
Day 15
|
I
|
444.00 + 6.00
|
0.077 + 0.002
(0.017 + 0.003)
|
0.137 + 0.007
(0.030 + 0.001)
|
0.027 + 0.002
(0.006 + 0.0004)
|
|
II
|
376.50 + 117.50
|
0.092 + 0.012
(0.026 + 0.005)
|
0.135 + 0.055
(0.035 + 0.003)
|
0.027 + 0.008
(0.007 + 0.0009)
|
|
III
|
405.00 + 50.00
|
0.112 + 0.017
(0.028 + 0.007)
|
0.167 + 0.012
(0.041 + 0.002)
|
0.035 + 0.005
(0.008 + 0.0001)
|
|
Day 30
|
I
|
567.50 + 17.50
|
0.112 + 0.002
(0.019 + 0.001)
|
0.157 + 0.002
(0.027 + 0.0004)
|
0.087 + 0.007
(0.015 + 0.001)
|
|
II
|
550.00 + 10.00
|
0.202 + 0.007
(0.036 + 0.002)
|
0.355 + 0.025
(0.064 + 0.005)
|
0.330 + 0.020
(0.060 + 0.004)
|
|
III
|
425.00 + 25.00
|
0.142 + 0.012
(0.033 + 0.005)
|
0.330 + 0.020
(0.077 + 0.0001)
|
0.315 + 0.015
(0.074 + 0.007)
|
|
Day 45
|
I
|
620.50 + 10.50
|
0.127 + 0.002
(0.020 + 0.005)
|
0.245 + 0.005
(0.039 + 0.0001)
|
0.242 + 0.007
(0.039 + 0.0005)
|
|
II
|
572.50 + 2.50
|
0.192 + 0.012
(0.033 + 0.002)
|
0.332 + 0.022
(0.058 + 0.004)
|
0.485 + 0.035
(0.084 + 0.006)
|
|
III
|
535.00 + 75.00
|
0.207 + 0.032
(0.038 + 0.0006)
|
0.402 + 0.007
(0.077 + 0.012)
|
0.522 + 0.047
(0.098 + 0.004)
|
|
Day 60
|
I
|
837.66 + 28.99
|
0.151 + 0.007
(0.018 + 0.0007)
|
0.203 + 0.008
(0.024 + 0.0002)
|
0.275 + 0.0132
(0.021 + 0.008)
|
|
II
|
690.00 + 25.81
|
0.267 + 0.015
(0.038 + 0.001)
|
0.288 + 0.019
(0.042 + 0.003)
|
0.502 + 0.136
(0.072 + 0.001)
|
|
III
|
607.50 + 21.26
|
0.231 + 0.012
(0.038 + 0.001)
|
0.301 + 0.033
(0.049 + 0.004)
|
0.502 + 0.010
(0.084 + 0.002)
|
|
 |