 |
|
|||||||||||||||||||||||||||||||||||||||||||||||||||||||||||||||||||||||||||||||||
|
|
 |
|
||||||||||||||||||||||||||||||||||||||||||||||||||||||||||||||||||||||||||||||||
|
|
|
 |
|
|||||||||||||||||||||||||||||||||||||||||||||||||||||||||||||||||||||||||||||||
|
|
|
|||||||||||||||||||||||||||||||||||||||||||||||||||||||||||||||||||||||||||||||||
|
|
|
|||||||||||||||||||||||||||||||||||||||||||||||||||||||||||||||||||||||||||||||||
|
|
|
|||||||||||||||||||||||||||||||||||||||||||||||||||||||||||||||||||||||||||||||||
|
|
|
|||||||||||||||||||||||||||||||||||||||||||||||||||||||||||||||||||||||||||||||||
|
|
|
|||||||||||||||||||||||||||||||||||||||||||||||||||||||||||||||||||||||||||||||||
|
2008, Vol. 3 No. 2, Article 27
Quality Evaluation of Rogenjosh Available in Srinagar City Asif. H. Sofi*a, Sarfaraz A. Wania, Mir Salahuddina, A. H. Malika, M. A. Pala and Z. H. Munshib
*Corresponding Author; Tel.: +91-9419539204;
Part of M.V.Sc thesis submitted by corresponding author to SKUAST- K ABSTRACT A study was carried out to find out the quality of Rogenjosh - a traditional Kashmiri meat product, available at various outlets of Srinagar city, in terms of physico-chemical (pH, moisture, protein, ether extract and ash), microbiological (Total Viable Count, Coliform count & presence of E. coli) and sensory quality. On the basis of infrastructure and services provided, outlets were divided into High standard (HS), Medium standard (MS) and Low standard (LS) restaurants. The results for moisture (%) and ether extract (%) differed significantly (p<0.05) between the outlets whereas pH, protein (%) and ash (%) showed non-significant (p>0.05) differences. The TVC and Coliform count showed increasing trend from HS to LS type. However, E. coli was present in 16.6 % of sample, (all from LS type). The overall acceptability score of the product from HS, MS and LS was found to be 6.46 ± 0.10, 5.90 ± 0.12 and 6.17 ± 0.12 respectively, on 8 point descriptive scale (8= extremely desirable, 1= extremely undesirable). KEY WORDS Market, Quality evaluation, Rogenjosh, Srinagar city, Traditional meat products. INTRODUCTION
Kashmir is well known for its traditional meat products like Rista, Kabab, Goshtaba, Korma etc collectively termed as
Wazwan. Rogenjosh forms an important component of wazwan and is a non-comminuted meat product prepared from meat chunks along with bones, cooked with various spices and condiments in gravy. The demand for ready-to-eat meat products including different
Wazwan products like Rogenjosh is increasing day by day due to growing awareness about their nutritional and palatability characteristics, changing socio-economic status and life style. These products also cater to the fast food requirement of a large number of domestic and foreign tourists visiting the valley. Thus these products need to be prepared hygienically so as to safe guard the health of consumers.
MATERIAL AND METHODS Survey 104 restaurants available in Srinagar city were surveyed. On the basis of their infrastructure and services provided, outlets were divided in to High standard (HS), Medium standard (MS) and Low standard (LS) restaurants. Collection A total of 18 samples, six from each type of outlet, were collected randomly and transported to the laboratory under aseptic and chilled conditions within shortest possible time for analysis. Laboratory Analysis The pH of the samples in duplicate was determined by using the method of Strange et al. (1977). Ten grams of sample was blended with 50 ml of distilled water for 1 minute. The pH of the resultant meat slurry was recorded by dipping the combination electrode of digital pH meter in it. The percentages of moisture, crude protein, ether extract and ash of Rogenjosh samples were determined as per standard procedure of Association of Official Analytical Chemists (AOAC, 1995). Microbiological quality in terms of Total Viable Count (TVC), Coliform count and presence of E. coli was determined as per Anon (2001). Sensory quality in terms of appearance, flavour, texture, saltiness, juiciness, mouth coating and overall acceptability was determined on 8 point descriptive scale (8= extremely desirable, 1= extremely undesirable) of Keeton (1983) modified and adopted by Division of LPT, Indian Veterinary Research Institute (Sharma et al. 1997). Statistical analysis Data obtained from the study were analyzed statistically following the method of Box et al. (1978). The data was processed in a computer using SPSS software package. The ANOVA of group means was computed and significance of means was tested by using least significant difference test (LSD) at 5% level of significance. RESULTS AND DISCUSSION
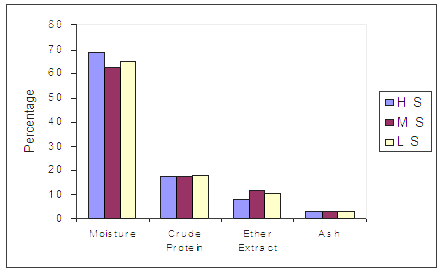
The pH of Rogenjosh (Table1) did not differ significantly (p > 0.05) among the samples with values of 6.10 ± 0.06, 5.98 ± 0.05 and 6.14 ± 0.08 from HS, MS and LS respectively. The moisture in case of HS (68.60 ± 0.67 %) was significantly higher (p
< 0.05) than both MS (62.70 ± 1.51%) and LS (65.04 ± 1.23 %). The probable reason for difference in moisture content could be because of difference in fat content in respective meat chops as fat and moisture is having an inverse relation (Samoon, 1988). Crude protein content in HS, MS and LS were comparable with values of 17.12 ± 0.45 (%), 17.82 ± 0.60 (%) and 17.99 ± 0.57 (%) respectively. Ether extract content did not differ significantly (p
> 0.05) between HS (8.32 ± 0.99%) and LS (10.61 ± 1.10 %). The samples from MS had significantly (p
< 0.05) higher ether extract content of 11.89 ± 1.38 (%) than samples of HS. However, MS and LS showed comparable values. The significant variation in fat (%) between different outlets might be because of difference in nature of meat chops used in developing such products. It could be due to liking, towards fatty chops, of customers visiting MS and LS type restaurants. Ash content of samples under study did not differ significantly (p
> 0.05) among the three types with values as 2.81 ± 0.20 (%), 2.69 ± 0.28 (%), 3.21 ± 0.29 (%). Ash (%) in LS was slightly higher than HS and MS which could be because of addition of more spices and other condiments in LS than HS and MS.
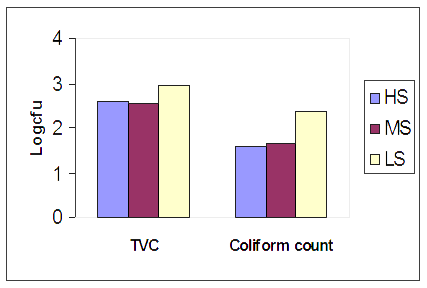
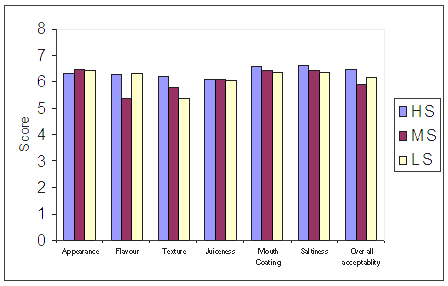
CONCLUSION The physico-chemical quality of Rogenjosh analysed showed varying results between the outlets. TVC and Coliform count showed increasing trend from HS to LS, however were well within permissible limits. E. coli detected from only LS type of outlets is an indication of poor hygiene during processing and post processing in LS than HS and MS. All the sensory parameters showed mixed scores between 5-7.
REFERENCES
Table 1: Physicochemical quality of Rogenjosh marketed in Srinagar city.
Row-wise group means (± S.E) with different superscript differ significantly (P < 0.05).
Table 2: Microbiological Quality of Rogenjosh marketed in Srinagar city.
Row-wise group means (± S.E) with different superscript differ significantly (P < 0.05).
Table 3: Sensory Quality of Rogenjosh marketed in Srinagar city.
Row-wise group means (± S.E) with different superscript differ significantly (P < 0.05)
Fig 1: Proximate Composition of Rogenjosh procured from different outlets in Srinagar city.
Fig 2: Microbiological quality of Rogenjosh procured from different outlets in Srinagar city.
Fig 3: Sensory characteristics of Rogenjosh procured from different outlets in Srinagar city.
|
|
|||||||||||||||||||||||||||||||||||||||||||||||||||||||||||||||||||||||||||||||||
|
|
||||||||||||||||||||||||||||||||||||||||||||||||||||||||||||||||||||||||||||||||||
|
|
||||||||||||||||||||||||||||||||||||||||||||||||||||||||||||||||||||||||||||||||||
|
|
||||||||||||||||||||||||||||||||||||||||||||||||||||||||||||||||||||||||||||||||||
|
|
||||||||||||||||||||||||||||||||||||||||||||||||||||||||||||||||||||||||||||||||||
|
Copyright © Vet Scan 2005- All Right Reserved with
VetScan |
Home | e-Learning |Resources | Alumni | Forum | Picture blog | Disclaimer |
|
||||||||||||||||||||||||||||||||||||||||||||||||||||||||||||||||||||||||||||||||
|
powered by eMedia Services |
|
|||||||||||||||||||||||||||||||||||||||||||||||||||||||||||||||||||||||||||||||||
|
|
|
|
|
|
|
|
|
|
|
|
||||||||||||||||||||||||||||||||||||||||||||||||||||||||||||||||||||||||


